Private pre-beta · under development

A coach that adapts to your reality.

A real training plan with a long-term shape and sessions detailed down to the interval.

Join the waiting listWhat we’re building

The real app: today’s session, and this morning’s readiness

Coming to iPhone, Android and the web · English, Danish and Spanish

RCoach06:41

Your HRV came in 13% below your own 30-day normal and your resting HR is up 5 bpm — together, that’s the clearest sign yesterday’s session hasn’t been absorbed yet. Let’s keep today easy and move the intervals to Thursday.

HRV48 ms↓ 13% vs normal
Resting HR47 bpm↑ 5 vs normal
Sleep6:10 −1:20 vs normal
Readiness 51 · Moderate
Proposal

Easy 6 km today · intervals moved to Thu

AcceptAdjust
Why we read HRV and resting HR together →
Connect itPowered by StravaWorks with Apple HealthHealth ConnectGarmin · COROS · Suunto — on the way

Health data you connect is stored in the EU and is never used to train anyone’s models.

Or just hand it over

No connected account needed — Runsei takes whatever you’ve got.

A plan you already followA photo or a PDF, structure intact.
A lab or field testYour zones stop being an estimate.
Anything you just tell it“Ran 8 km easy, calf tight from 6.”
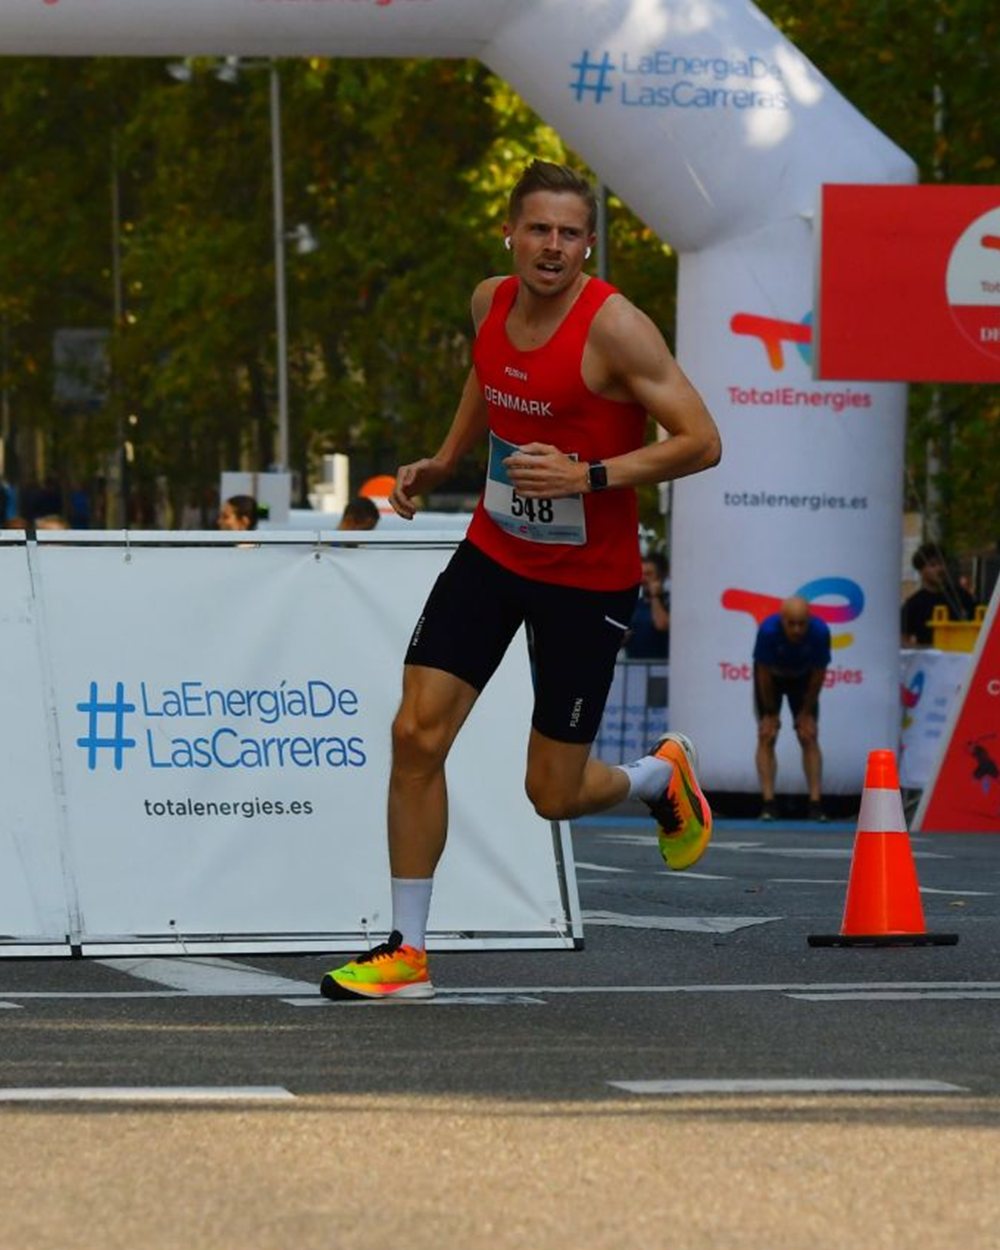
Andreas, Runsei’s founder, out on a run
The human behind it

Built by a runner who needed it.

I’m Andreas — an engineer and a runner, training around a full work and family life in Denmark. I was also born with a club foot, so adjusting has never been optional for me: the asymmetry brings injuries, small kids bring weeks of illness, and every serious plan I followed broke the same way — life intervened, and the plan didn’t care.

I’ve tried most of the running apps, and each fell short somewhere. A plain AI chat falls shortest: it can’t hold a plan’s structure or stay consistent from one answer to the next. Runsei is the coach I wanted instead — it keeps your plan as real structure, watches how the training actually goes, asks what happened, and reshapes it around reality. Conservative by default, honest when it matters. It proposes; you decide.

Andreas Schmidt · Founder, Improva Labs · sub-35 10K

Your plan

A plan with a shape — and sessions you can just go and run.

The point of a coach is that you stop designing your own training. Runsei holds the long-term structure, writes the sessions in full, and it’s on you to turn up. Then it checks whether the plan is actually landing — and fixes the plan, not you.

The long view

Phases, not a pile of runs

Your block has a shape you agree up front — what each phase is for, how long it runs, where the race sits. Individual sessions are written about a week before their phase begins, so they’re built on the runner you are by then, not the one you were at signup.

How your plan is built
Marathon block · 16 weeksweek 7
Basewk 1–525 of 25 sessions run
Thresholdwk 6–10Detailed sessions planned
VO₂maxwk 11–13Sessions still to be planned
Taperwk 14–16Sessions still to be planned

You always know what you’re in the middle of and what’s coming. Nothing is written so far ahead that it stops fitting you.

The session

Detailed down to the interval

Not “tempo run, 45 min.” Every step, every target, every recovery — the same structure your watch can execute, because the workout file and the screen are built from one model. Turn up, press start, run it.

Sending a session to your watch
Thu · Threshold12.4 km · 58 min
Warm-up15 min easy≤ 150 bpm
6 ×1 km at threshold3:36–3:42 /km
Recovery90 s jog betweeneasy
Cool-down10 min easy≤ 150 bpm
Garmin.fit workout todayDirect sync — not offered by Garmin yet
COROS.fit workout todayDirect sync — planned
Suunto.fit workout todayDirect sync — being explored
Apple WatchHealth sync live todayGuided workout — planned
Your only job

Check adherence. Runsei fixes the plan.

One word tells you whether the block is delivering what it was written to deliver — and opening it shows exactly which sessions moved it, worst first, each one reaching the run behind it. If the answer is “not really”, that’s a conversation about the plan, not a verdict about you.

How adherence is judged
Threshold phase · 14 sessions11 of 14 scored
Going well84 / 100

The work is landing where it was meant to. A session or two drifted, which is normal.

Tue 14 Jul — 5×1 km, cut to 3 reps58Open →
Sun 12 Jul — long run, last 8 km above easy71Open →
Wed 9 Jul — tempo, 20 s/km fast throughout74Open →

One session was cut short; the other two were run too hard, not too easy — a sign the paces are pitched slightly low. So the coach raises them, rather than telling you to push more.

What your running shows

Every number leads to the method behind it.

Nothing here is a generic formula applied to you — it’s computed from your own runs, and each one opens onto how it was worked out.

Every run, graded

The Execution Score

A session is graded on fidelity to what it was for — not on how fast you ran it. Hold threshold effort up a hill and the slower pace still scores as on-stimulus. It’s deterministic and published: the same run always scores the same, and when there isn’t enough data to grade it honestly, you get no score rather than an invented one.

How the score is built
Last 8 sessionsavg 87
90 · Executed as designed Executed as designed / Solid execution Partial — a gap to close

The outlined bar — Thu, 6×1 km, hilly: pace 14 s/km slower than target, heart rate on target. Scored 94 · Executed as designed. Slowing to hold effort on a climb is the correct response, not a miss.

Are you building or overreaching

Training load, read as a shape

Your 42-day Base is what your body is prepared for; your 7-day Recent is what you’ve asked of it lately. What matters isn’t a high number — it’s a sudden one. Load that rose week over week reads as a controlled build, not as ramping too fast.

How load is computed
Base vs Recent · 12 weeksratio 1.17
12 weeks agothis week
Recent · 7 days Base · 42 days

Building steadily — Recent sits above Base, but it got there over ten weeks. No spike.

Is the training working

Aerobic efficiency

The honest test of aerobic fitness isn’t a hard day — it’s what an easy day costs you. Runsei tracks how much ground you cover per heartbeat on aerobic runs. Every easy run is a data point, so unlike a race-time estimate the line actually trends — smoothed weekly, so one hot or hilly run can’t move it.

How efficiency is tracked
Distance per heartbeat · easy runs · 10 weeks↑ 3.4%
more efficient ↑
10 weeks agothis week

Your aerobic engine is improving — the same effort now covers more ground per beat, about 11 s/km faster at the same heart rate than ten weeks ago.

What you could run

Your current potential

Several established models are fitted to your own hard efforts, not to a population table, and the set carries one honest confidence. A distance longer than anything you have actually run hard is marked as beyond your efforts, rather than sold as a promise.

How race predictions work
Fitted to 6 hard efforts of yoursHigh confidence
DistancePredicted
5 km16:52
10 km35:10
Half1:17:40beyond your efforts
Marathon2:42:00beyond your efforts
Are you on track

Race day, projected honestly

Your real races, today’s estimate, and where your aerobic trend points on race day, drawn as a range that widens the further out it looks. If it lands slower than your goal, it says what is realistic, not that you are failing.

How the projection works
The Race day projection card in the Runsei app: now 21:33, race day 21:04, goal 16:00
Recovery

Measured against you, never a population.

Your trends compare every recovery signal with your own normal — a 30-day median that deliberately leaves out the last week, so a hard block can’t quietly redefine what “normal” means for you. There is no such thing as a good HRV number; there is only your trend.

48 ms↓ 13%
HRV · your normal 55 ms

Down the day after a hard session is expected — that’s training working. Down for several days running is the load outweighing the recovery.

47 bpm↑ 5
Resting HR · your normal 42 bpm

The most robust of the signals, and the one that often notices an illness a day before you do. Paired with a suppressed HRV, it’s the pattern worth acting on.

6:10−1:20
Sleep · your normal 7:30, ±1:05

Duration isn’t the whole measure. How much your nights vary has its own effect, so your coach sees how much your nights vary, not only their average.

Wear something overnight and these arrive on their own — the morning check-in then asks only the one thing no watch can measure: how you feel. Tell us you don’t, and it never asks you for a number again.

And underneath

The parts that make it usable on a Tuesday.

Your plan

  • Built around your goal, your days and your real paces
  • Import a plan you already have — a photo or a PDF
  • Phases you can see, and a goal you can ask to review
  • Every change logged, traceable and reversible in one tap

On the run

  • Structured sessions — warm-up, reps, targets — not paragraphs
  • Export any session as a .fit workout your watch steps you through
  • Subscribe to your plan from Apple, Google or Outlook Calendar
  • Weather on the session, and factored into how the run is read

Talking to your coach

  • A real conversation — it plans, explains and logs
  • Talk instead of typing; send a photo or a PDF
  • Injuries and constraints it remembers and trains around
  • Notifications you control, one line at a time

Your data

  • Stored in the EU, with an EU-only mode for the AI
  • Never used to train anyone’s models
  • Export everything Runsei holds, as one file
  • Disconnect any source at any time — every connection is reversible
The science

Grounded in published research — and honest about how strong it is.

Every method Runsei uses is explained in plain language and cites what it rests on. Where the evidence is modest, we say so rather than dressing it up.

Reading HRV
Plews, Laursen, Stanley, Kilding & Buchheit (2013). Training adaptation and heart rate variability in elite endurance athletes: opening the door to effective monitoring. Sports Medicine 43(9), 773–781. ReadWhy a rolling baseline — not a single morning reading — is the only usable way to read HRV.
Adapting to readiness
Manresa-Rocamora, Sarabia, Javaloyes, Flatt & Moya-Ramón (2020). Effectiveness of training prescription guided by heart rate variability versus predefined training for physiological and aerobic performance improvements: a systematic review and meta-analysis. Applied Sciences 10(23), 8532. ReadLetting recovery shape the training week has a small-to-medium benefit on submaximal markers. Real and worth doing — not a revolution, and we do not claim one.
Sleep
Windred, Burns, Rutter, Yeung, Lane, Xiao, Saxena, Cain & Phillips (2024). Sleep regularity is a stronger predictor of mortality risk than sleep duration: a prospective cohort study. SLEEP 47(1), zsad253. ReadWhy we report how much your nights vary, and not only what they average.
Terrain
Minetti, Moia, Roi, Susta & Ferretti (2002). Energy cost of walking and running at extreme uphill and downhill slopes. Journal of Applied Physiology 93(3), 1039–1046. ReadThe energy-cost curve our grade adjustment is built on.
Race predictions
Blythe & Király (2016). Prediction and Quantification of Individual Athletic Performance of Runners. PLOS ONE 11(6), e0157257. ReadEach runner follows their own power law of time against distance, with a personal exponent: the idea the prediction is built on.Riegel (1981). Athletic Records and Human Endurance. American Scientist 69(3), 285–290. The classic fixed-exponent formula (first published in Runner’s World, 1977): the default factor and one of the compared models.Daniels & Gilbert (1979). Oxygen Power: Performance Tables for Distance Runners. Self-published, Tempe, Arizona. The VDOT model among the compared models.Jones, Vanhatalo, Burnley, Morton & Poole (2010). Critical power: implications for determination of V̇O₂max and exercise tolerance. Medicine & Science in Sports & Exercise 42(10), 1876–1890. ReadWhat Critical Speed is, and why it marks the boundary just above your threshold.
Easy vs quality
Seiler & Kjerland (2006). Quantifying training intensity distribution in elite endurance athletes: is there evidence for an "optimal" distribution?. Scandinavian Journal of Medicine & Science in Sports 16(1), 49–56. ReadWhere the roughly 80/20 split comes from — what well-trained endurance athletes actually do.Stöggl & Sperlich (2014). Polarized training has greater impact on key endurance variables than threshold, high intensity, or high volume training. Frontiers in Physiology 5, 33. ReadA controlled comparison of the distributions, rather than an observation of them.
Training load
Impellizzeri, Woodcock, Coutts, Fanchini, McCall & Vigotsky (2020). Acute:chronic workload ratio — conceptual issues and fundamental pitfalls. International Journal of Sports Physiology and Performance. ReadWhy we read the shape of your load rather than drawing a line at a "sweet spot" number.

Read the full methodology — 26 articles, the same ones your coach reads →

Private pre-beta · under development

Join the waiting list.

Runsei is in private testing with a small group. Join the list to hear the moment we launch — and raise your hand if you’d like to be one of the first beta testers.

One email when Runsei launches — nothing else unless you tick it. Unsubscribe anytime.

Private pre-betaJoin the waiting list